


























Nemely — CRM starts with us.

What are you looking for?

Browse all pages

Data & decisions

See the signal. Understand the detail.

Turn reporting into a working tool for management. Nemely designs Microsoft Power BI solutions that connect a clear question, an agreed measure and the detail needed to act.

A professional in a navy shirt working between a laptop and tablet at a warm wooden desk
Microsoft Power BIPower QueryCopilot in Power BI

A few organizations we've worked with

A useful report earns its place in the meeting.

Lead with the signal. Let people investigate what is behind it. Keep the model, refresh and access understandable enough for the report to stay useful.

Inside Power BI

Follow a performance signal into the detail.

Power BI’s decomposition tree breaks a measure down across different dimensions. In Microsoft’s supply-chain example, readers can explore backorders by factors such as demand type and product. We design that exploration around the questions your managers actually ask.
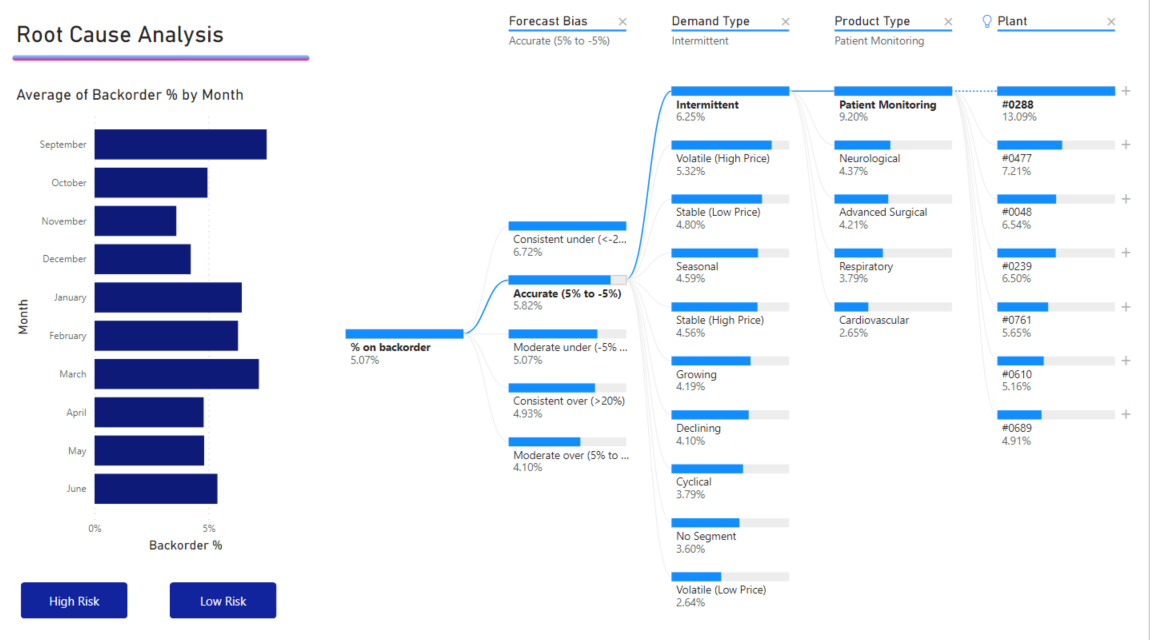
Power BI decomposition tree exploring backorder rates across demand, product and plant categories

Microsoft Power BI documentation example using sample supply-chain data. The displayed figures illustrate exploration, not Nemely client results or a promised performance improvement.

Source: Microsoft Learn


A business analyst comparing notes and information beside an open laptop

The model behind the view

Agree what the number means before styling it.

A polished dashboard cannot settle an argument about what counts as an active customer or a completed order. We work with business owners to define measures, calendar logic and the level of detail, then implement those decisions in a reusable semantic model.

  • Document the definition and who can approve a change.
  • Reconcile a representative period with the source system.
  • Test access for the people who will read the report.
Explore the data quality foundation

From launch to a working habit

Design for the person who opens it on Monday.

A finance lead, service manager and regional director need different routes through the same information. We make report navigation, filters and supporting detail fit their tasks, then work through real questions with users so they can interpret the result without an analyst beside them.

Plan practical Power BI training
Two colleagues reviewing a printed document beside an open laptop

How Nemely helps

A report your business can explain.

We bring the report owner and data owner together early, so visual design and dependable calculation develop as one piece of work.

Data & Solution AuditSystem IntegrationTraining and Workshops

Frame a management question

Select the meeting and the decision. Sketch the few measures and comparisons needed to make that discussion productive.

Build and reconcile the model

Connect the agreed sources, implement calculations and test them against real records, including exceptions and access rules.

Release with the report owner

Observe a working session, refine the navigation and hand over refresh checks, definitions and a practical support routine.

Planning notes

Before your Power BI project starts

Refresh, support and ownership

Agree the refresh window, the person who investigates failures and the process for changing measures. Choose a connection and model approach after examining source availability, data volumes and the freshness the decision requires.

Copilot as a reading aid

Copilot can produce natural-language summaries grounded in Power BI report content. We test representative questions, inspect the referenced visuals and keep review of the answer in the workflow. The page shown above demonstrates decomposition, a separate analytical feature.

FAQs

Your questions, answered.

Can Nemely improve our existing Power BI reports?

Yes. An assessment can look at repeated calculations, slow or confusing pages, refresh issues and how people use the reports. We can prioritise changes while keeping the definitions and reports that already work.

Should every department use the same dashboard?

Shared definitions can support several focused reports. Each audience should see a useful level of detail and appropriate access, while the underlying measures remain consistent.

Will a dashboard automatically explain why performance changed?

It can help you investigate, but an apparent relationship is not a verified explanation. We design reports to expose useful differences and make it easier to validate them with business context.

What affects the cost and timing of a Power BI project?

Source readiness, transformations, measure definitions, security and refresh requirements shape the effort. We agree the decisions and audiences the first reports will support, then review licensing, capacity and distribution needs. Cleaning source data or building new integrations may require separately scoped work.

What should we prepare for a reporting review?

Bring the report people use today and an example of a decision it should help them make. Identify disputed figures, repeated manual work and the owners of the source data. Agreement on a few important measures gives the review a clearer starting point than a long list of charts.

Explore the Microsoft capabilities

Explore the Microsoft capabilities

Build for today. Keep a view of what comes next.

Microsoft is moving Dynamics 365, Power Platform and Dataverse updates to the AI at Work roadmap from September 2026. We use the current feature status when planning your solution, and evaluate previews separately before proposing them for production.

Explore Microsoft’s roadmap approach

Capabilities reviewed 8 September 2026. Licensing, configuration, language and regional availability vary by feature.

Your next step

Let’s make your next step concrete.

Show Stefan the dashboard your team works around. We can discuss the definitions, report design or data preparation needed to make it useful in the next management meeting.

Contact us
Stefan Christiansson, CEO & Solutions Architect at Nemely, beside a blue-framed window with a city backdrop
Stefan ChristianssonCEO & Solutions Architect

Get resource